Key Market Statistics
The charts and tables on this page highlight the market leading performance that precious metals have delivered over the short, medium and long-term;
The following charts and tables illustrate:
The price of gold and silver in troy ounces (oz) in both AUD and USD terms from January 1999 to August 2025 (chart 1).
The long-term compounded annual growth generated by gold and silver, in both AUD and USD terms over multiple time periods to end August 2025 (table 1).
Annualised investment returns comparing gold and silver to other asset key classes over multiple time periods to end June 2025 (table 2).
Annual calendar year returns for gold and silver in both AUD and USD terms since the turn of the century (table 4).
Chart 1: Gold and Silver Prices in AUD and USD (Jan 1999 to Aug 2025)

Sources: LBMA, RBA, ABC Bullion
The above chart highlights how strong the rise in precious metal prices has been since the turn of the century, with gold in particular leading risk assets over this time period.
In Australian dollar terms, gold has risen from below AUD $500oz to over $5,400oz, while silver has risen from below $8oz to over $60oz over this period.
Table 1: Compound Annual Growth Returns (%) - Gold and Silver in AUD and USD (Jan 1999 to Aug 2025)

Sources: LBMA, RBA, ABC Bullion
The above table highlights the performance of both gold and silver over a range of distinct time periods to the end of August 2025.
Over the past twenty-five years, both metals have risen notably, with silver up by 8.1% per annum in AUD terms (8.9% in USD terms), while gold has risen by 10.1% per annum in AUD terms (10.9% in USD terms).
Both metals, most notably gold, have been market leading performers over this quarter century time period.
Table 2: Annualised Investment Returns (%) - Gold and Silver in AUD vs Other Asset Classes (Jun 1971 to Jun 2025)

Sources: LBMA, RBA, Chant West, Australian Bureau of Statistics, Bloomberg Finance L.P., Melbourne Institute of Applied Economic & Social Research, MSCI Inc., S&P Dow Jones Indices LLC., WM Reuters.
Notes: 1. Per annum total returns to 30 June 2025. 2. LBMA monthly price data, RBA AUDUSD price data, ABC Bullion Calculations. 3. Chant West Superannuation Growth Fund Returns. 4. S&P 500 Total Return Index (in AUD). 5. S&P/ASX All Ordinaries Total Return Index. 6. MSCI World ex-Australia Net Total Return Index AUD Index. 7. S&P/ASX 200 A-REIT Total Return Index. 8. Bloomberg AusBond Composite 0+ Yr Index. 9. Bloomberg AusBond Bank Bill Index. 10. ABS Consumer Price Index. 11. Proxied returns using Vanguard Historical Return Data (assuming 70% Australian Shares, 20% Australian Bonds and 10% Cash asset allocation).
The table above highlights the historical performance of multiple asset classes, including gold and silver, as well as a diversified superannuation portfolio, over multiple time horizons to the end of June 2025.
As the table demonstrates, both gold and silver have generated above average returns over short-, medium- and long-term time horizons with strong outperformance over the last 25 years against most major asset classes while also offering great diversification benefits within a portfolio.
Notably, the two precious metals have strongly outperformed the returns generated by cash in the bank over the last 30 years, something that may well continue given the Reserve Bank of Australia (RBA) commenced another interest rate cutting cycle in February 2025, with the cash rate ending August 2025 at just 3.60%, and likely to head lower.
Table 3: Annual Calendar Year Returns - Gold and Silver in AUD and USD (Jan 1999 to Aug 2025)
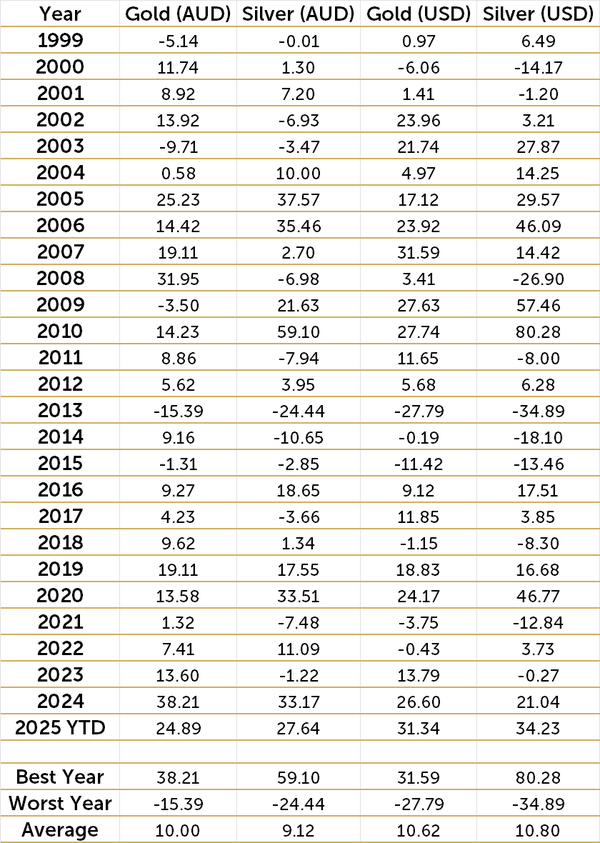
Sources: LBMA, RBA, ABC Bullion
Both gold and silver have delivered strong long-term returns in both AUD and USD terms, averaging around 10% and 9.1% respectively on an annual basis since 1999.
The standout years include 2010 for silver (+59.1% AUD, +80.3% USD) and 2024 for gold (+38.2% AUD, +26.6% USD), while 2013 marked the weakest year with declines seen across both metals.
Despite the short-term volatility that can be observed with precious metals, long-term performance trends like those seen in the above table highlights gold and silver’s resilience as long-term performers in both domestic and global terms.
Want more information about precious metals?
Download the ABC Bullion investment guide.
ABC Bullion is proud of its reputation as the region’s leading precious metal educator. Our annual precious metal investment guide is the perfect tool for new investors, highlighting the key reasons to invest in gold and silver.
The guide also features key products investors commonly select when allocating money to precious metals, as well as FAQs that our clients ask.